Understand the impact of AI on your workforce
A role-by-role assessment that reveals how AI is changing work, where capacity can be unlocked and which skills your organisation will need next.


HR assessment report, with additional time required for other business functions.

A focused assessment of the roles that matter most to your organisation.

From understanding your organisation to identifying opportunities and developing a practical roadmap.
See the bigger picture. Understand the detail
The Insight222 AI Impact Assessment™ brings complex workforce analysis together in one interactive dashboard.
Move from an organisation-wide view of AI's potential impact to a detailed understanding of individual roles, tasks and opportunities.
Explore the findings, compare priorities and uncover the insights needed to make confident decisions about your workforce.
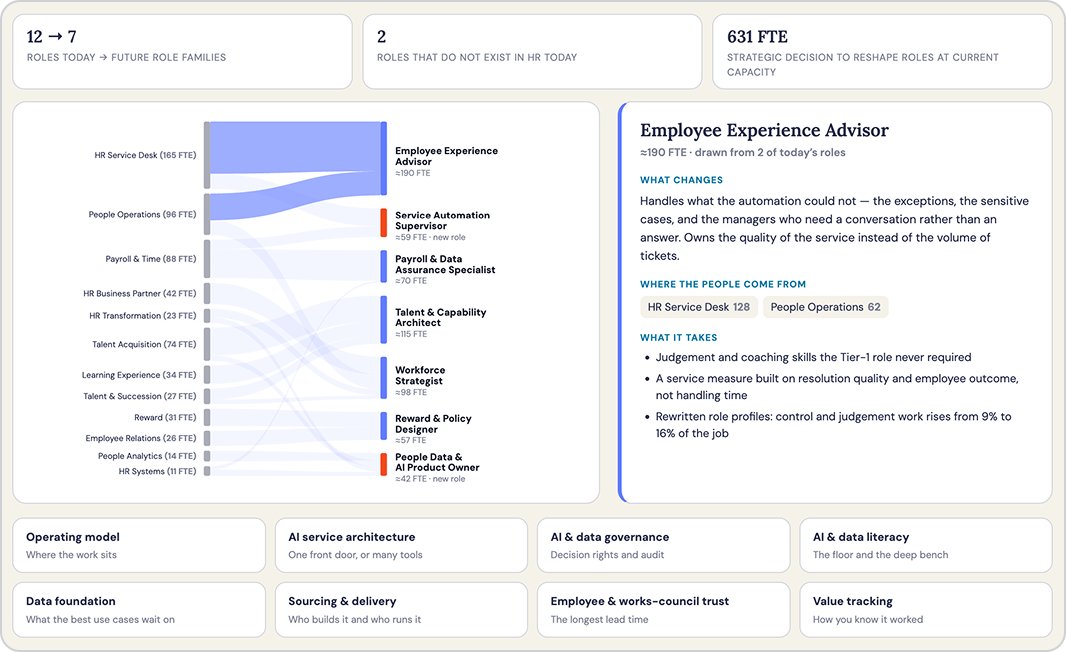
Portfolio overview
Understand where AI could have the greatest impact across the roles assessed, helping you identify priorities and focus your efforts.
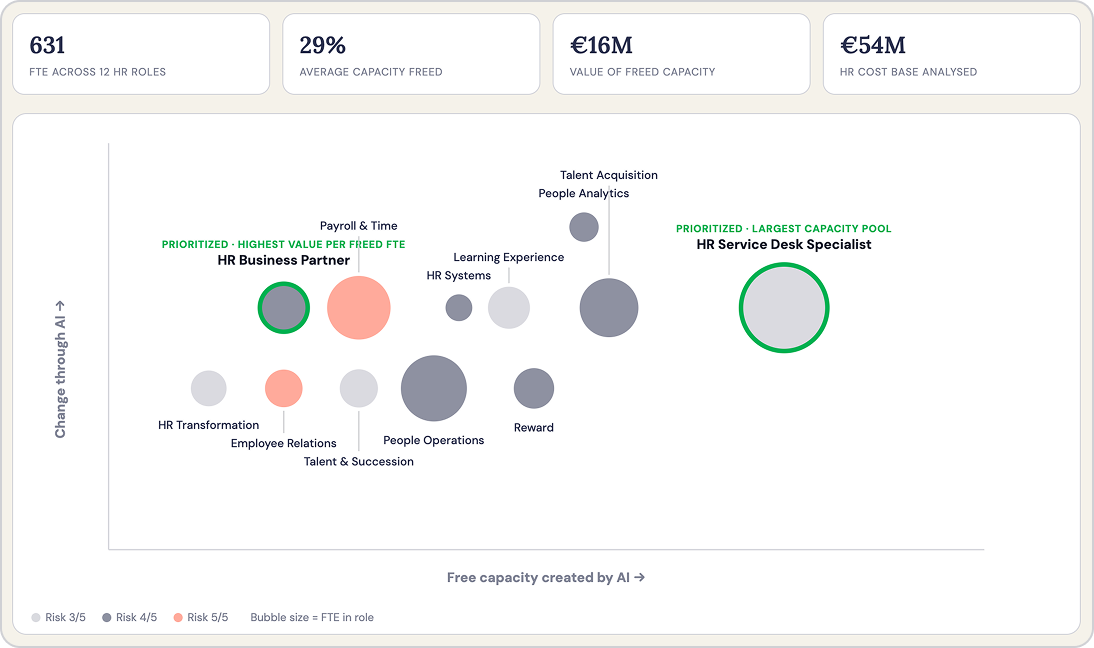
Role Analysis
Explore how AI could change individual roles, including opportunities for automation, augmentation and capacity release.
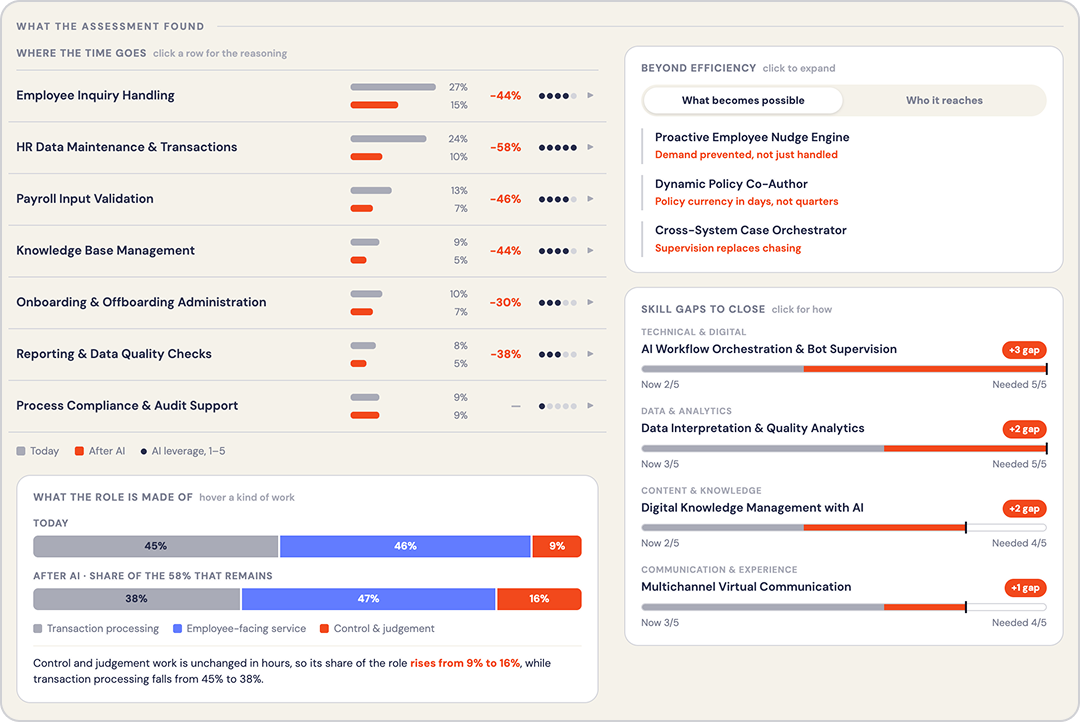
Task-level insights
Understand which activities are most likely to change and where human expertise will remain essential.
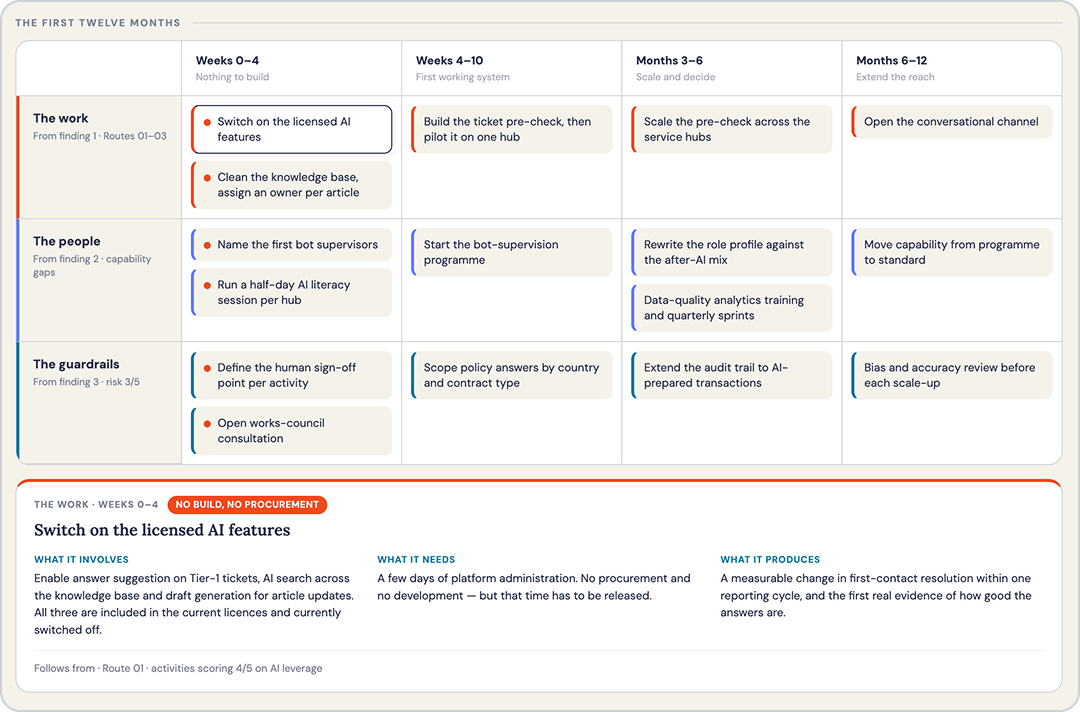
Future operating model
Explore how responsibilities, capabilities and ways of working could evolve as AI becomes embedded in your organisation.
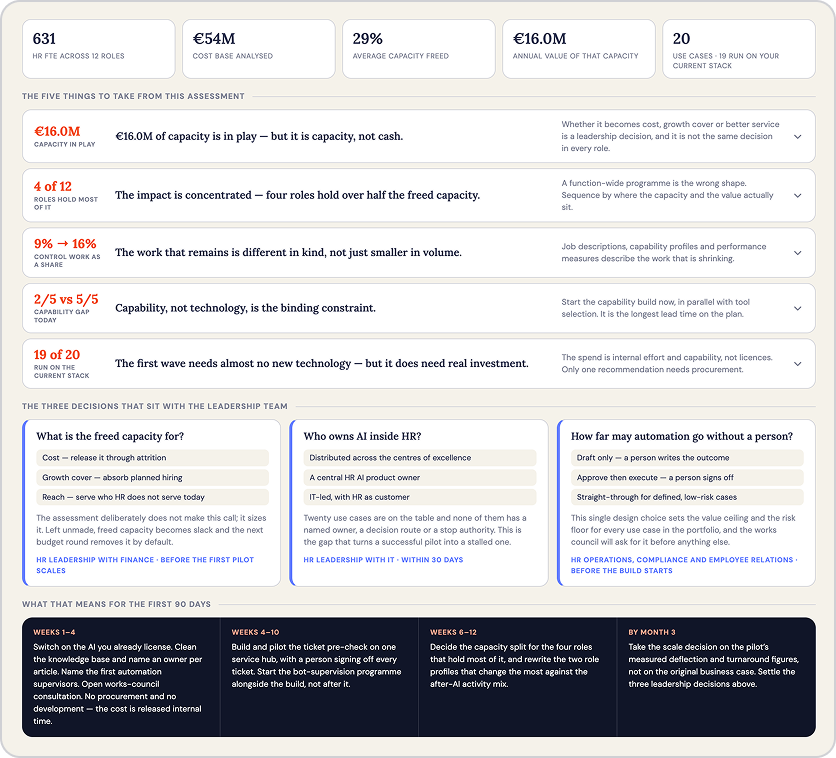
Management summary
Bring the findings together into a clear view of opportunities, implications and recommended priorities.
How the assessment works
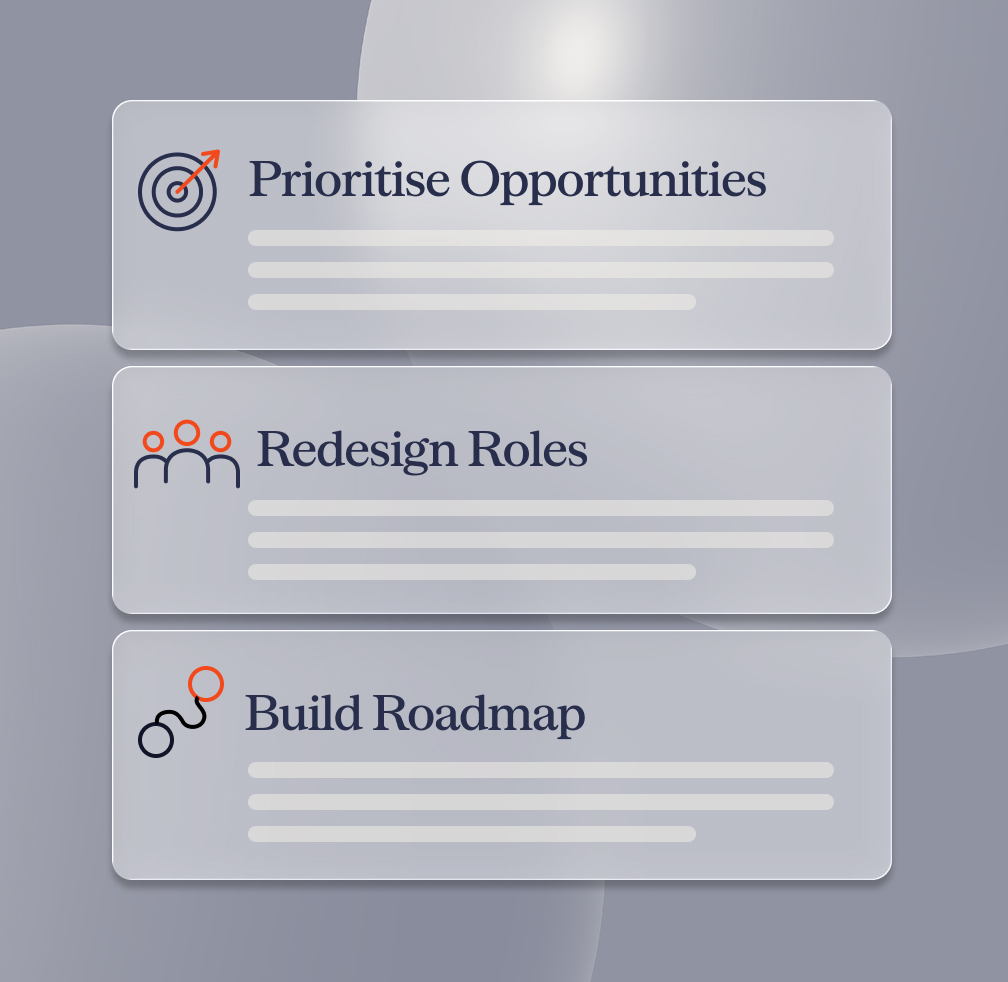
A structured, three-step process that transforms workforce data into meaningful insights and practical actions.
Start with your organisation.
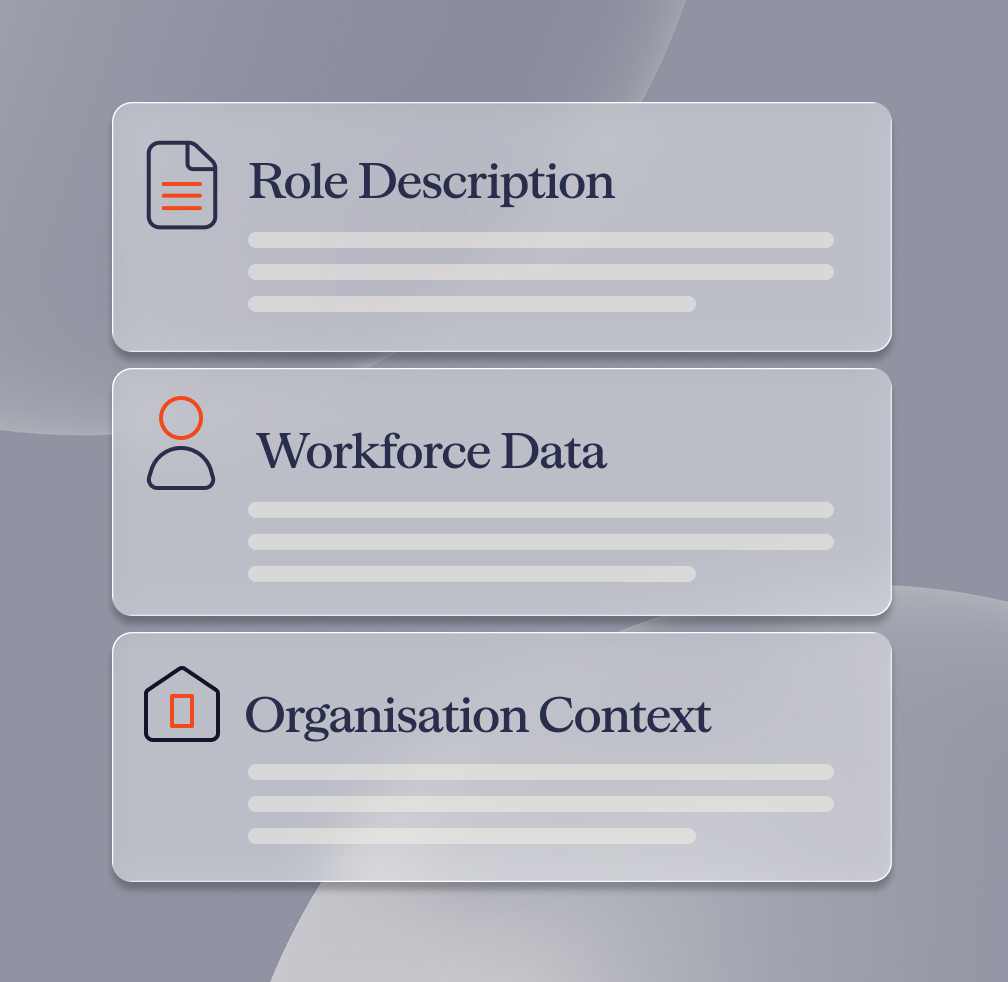
Every organisation is different. We begin by understanding your business priorities, workforce structure and the roles you want to assess.
Using your existing role descriptions, workforce data and organisational context, we establish a company-specific foundation for the assessment.
This ensures the analysis reflects how work is actually performed within your organisation, rather than relying solely on generic job profiles.
Reveal where AI changes work.
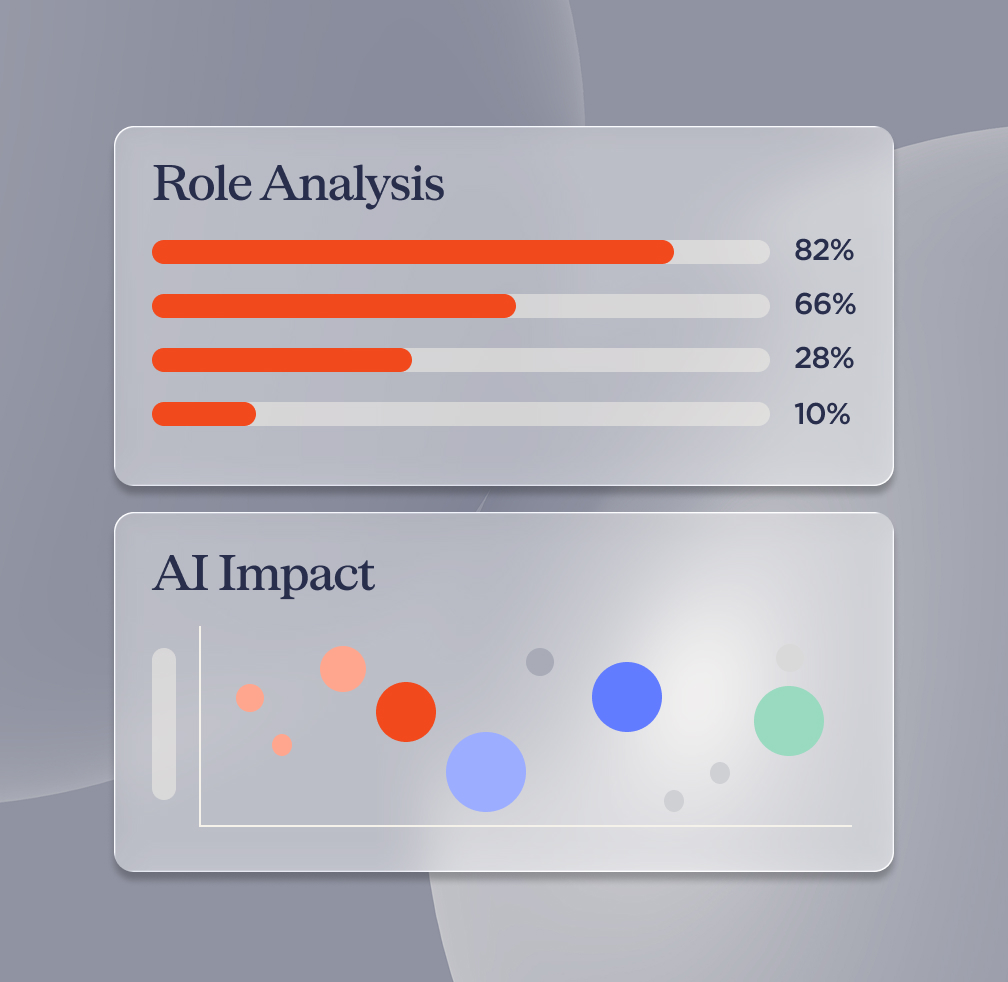
Using our expert-validated knowledge base and AI-powered analysis, we assess individual roles at task level to understand how AI could change the way work is performed.
The assessment identifies opportunities for automation and augmentation, estimates the capacity that could be released and highlights how responsibilities and skills may evolve.
Findings are presented through an interactive dashboard, allowing you to explore the impact of AI across functions, roles and activities.
Turn insight into action.
Understanding the potential impact of AI is only the beginning.
We work with your leadership team to interpret the findings, identify the most valuable opportunities and develop a practical roadmap for action.
Together, we explore where AI investment should be prioritised, how roles and responsibilities may need to evolve and what steps are required to prepare your workforce for change.
A clearer picture of how
AI could transform your workforce
Move beyond assumptions and understand where AI could create value, how work may change and what your organisation needs to do next.

Prioritise AI opportunities
Identify the roles and activities where AI could deliver the greatest value, helping you focus investment and resources where they matter most.

Understand workforce capacity
Estimate the time and capacity AI could release, revealing opportunities to redirect effort towards higher-value work.

Redefine roles and skills
Understand how responsibilities may evolve, which capabilities will become more important and how your workforce can prepare for change.

Redefine roles and skills
Translate the findings into clear priorities and actions that support AI adoption and workforce transformation.
Expert insight.
Company-specific evidence.
Faster decisions
AI is changing how work gets done, but understanding what that means for your organisation requires more than generic predictions. The Insight222 AI Impact Assessment™ combines specialist People Analytics and HR Transformation expertise with AI-powered analysis to deliver meaningful, organisation-specific insights.
Built on a knowledge base informed by more than 150 experts, combining technology with deep understanding of work, roles and organisational transformation.
Grounded in your organisation's roles, workforce data and business context, helping you understand the opportunities and implications that matter to you.
A focused assessment designed to accelerate understanding and support faster, more confident decision-making.
Beyond identifying AI opportunities, we help your leadership team interpret the findings and develop a practical plan for what comes next.
Assess AI's impact across
your organisation
Whether you're assessing your HR function or exploring AI's potential across the wider business, the AI Impact Assessment™ provides the insights needed to understand change and identify opportunities.
The same core methodology applies to both, with additional validation for functions beyond HR.
Let's discuss your
AI Impact Assessment
Tell us a little about your organisation and we'll be in touch to discuss your requirements.